
How to Interpret Weather Satellite Images: Understanding Satellite Imagery for Weather Analysis
As a professional meteorologist with over a decade of experience in weather analysis, I have come to appreciate the importance of satellite imagery in weather forecasting. Satellite imagery provides a bird’s eye view of the earth’s atmosphere and allows meteorologists to track weather patterns, monitor severe weather events, and make accurate predictions.
However, interpreting weather satellite images can be a daunting task, especially for those who are not familiar with the technical jargon and the various types of satellite imagery available. In this article, I will guide you through the basics of interpreting weather satellite images and provide you with tips and tricks to make the process easier.
What is Weather Satellite Imagery?
Weather satellite imagery is a type of remote sensing technology that uses satellites orbiting the earth to capture images of the planet’s atmosphere. These images provide information on cloud cover, temperature, moisture content, and other atmospheric variables that are essential for weather forecasting.
Types of Weather Satellite Imagery
There are several types of weather satellite imagery available, including visible, infrared, and water vapor imagery. Each type of imagery provides different information on the atmosphere and is used for specific purposes in weather analysis.
- Visible Imagery
- Infrared Imagery
- Water Vapor Imagery
How to Interpret Weather Satellite Images
Interpreting weather satellite images requires an understanding of the various atmospheric variables that are represented in the imagery. By analyzing the patterns and colors in the images, meteorologists can track weather patterns, monitor severe weather events, and make accurate predictions.
| Atmospheric Variable | Representation in Satellite Imagery |
|---|---|
| Cloud Cover | Bright white areas in visible imagery |
| Temperature | Warmer colors (reds, oranges) in infrared imagery indicate higher temperatures |
| Moisture Content | Darker areas in water vapor imagery indicate higher moisture content |
By understanding the representation of these variables in satellite imagery, you can interpret weather satellite images and gain valuable insights into the earth’s atmosphere.

Why is Weather Satellite Imagery Important?
Weather satellite imagery plays a crucial role in modern weather forecasting and severe weather detection. With the help of advanced technology, weather satellites can capture images of the Earth’s surface and atmosphere from space. These images provide valuable information about current weather conditions, which can be used to create accurate weather forecasts and detect severe weather events.
Weather Forecasting
Weather satellite imagery is an essential tool for weather forecasting. By capturing images of the Earth’s surface and atmosphere, weather satellites can provide meteorologists with valuable data about temperature, humidity, cloud cover, wind patterns, and other weather-related phenomena. This information is used to create weather models that can predict weather patterns and conditions several days in advance.
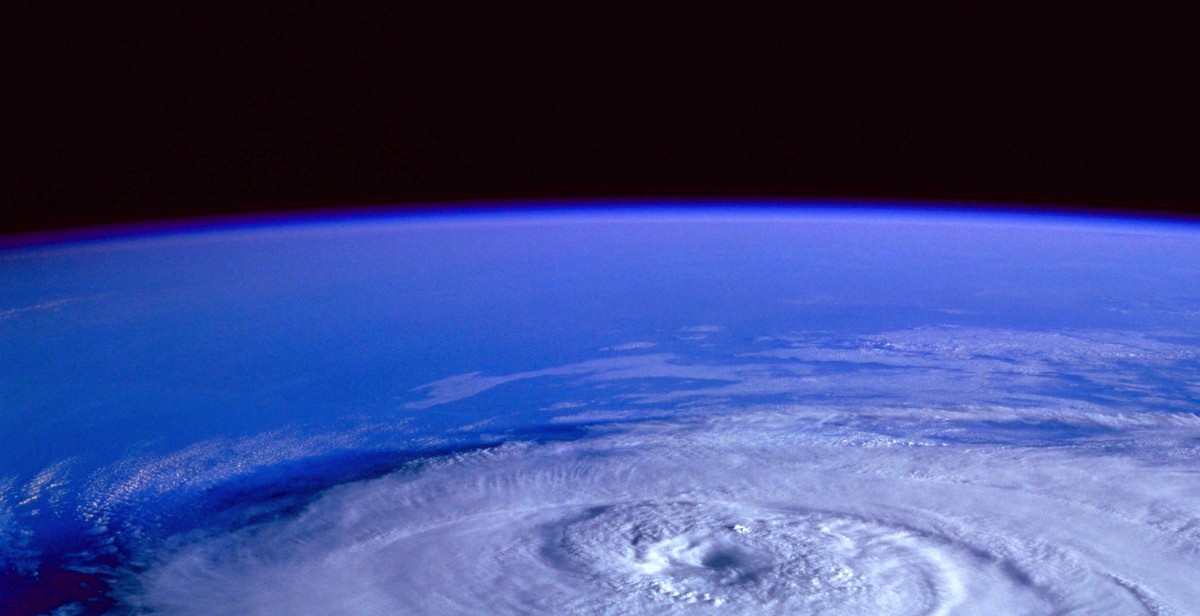
Weather satellite imagery is particularly useful for tracking the movement of weather systems, such as hurricanes, tornadoes, and thunderstorms. By monitoring the development and movement of these systems, meteorologists can issue timely warnings and alerts to help people prepare for severe weather events.
Severe Weather Detection
Weather satellite imagery is also critical for detecting severe weather events. By capturing images of the Earth’s surface and atmosphere, weather satellites can identify areas where severe weather is developing or already occurring. This information is used to issue severe weather warnings and alerts, which can help people take necessary precautions to protect themselves and their property.
For example, weather satellite imagery can be used to detect the formation of hurricanes and track their movement. This information is used to issue hurricane warnings, which can help people in affected areas prepare for the storm’s arrival and evacuate if necessary. Weather satellite imagery can also be used to detect tornadoes and thunderstorms, which can cause significant damage and loss of life.
| Uses of Weather Satellite Imagery | Examples |
|---|---|
| Weather Forecasting | Creating weather models, predicting weather patterns |
| Severe Weather Detection | Detecting hurricanes, tornadoes, thunderstorms |
Types of Weather Satellite Images
Weather satellite images come in different types, each providing valuable information for weather analysis. Here are the three main types of weather satellite images:
Visible Imagery
Visible imagery is captured by weather satellites using visible light. This type of imagery is similar to what we see with our own eyes, showing clouds, land, and water bodies. Visible imagery is useful for determining cloud cover, cloud types, and identifying surface features such as storms, hurricanes, and wildfires.
Infrared Imagery
Infrared imagery is captured by weather satellites using infrared radiation. This type of imagery shows the temperature of clouds and land surfaces. Warmer temperatures appear brighter, while cooler temperatures appear darker. Infrared imagery is useful for detecting areas of high and low pressure, identifying thunderstorms and their intensity, and tracking the movement of weather systems.
Water Vapor Imagery
Water vapor imagery is captured by weather satellites using the amount of water vapor in the atmosphere. This type of imagery shows the movement of moisture in the atmosphere, which is important for predicting weather patterns. Water vapor imagery is useful for identifying areas of high and low pressure, tracking the movement of storms, and detecting the formation of tropical cyclones.
| Type of Imagery | What it Shows | Uses |
|---|---|---|
| Visible Imagery | Cloud cover, cloud types, surface features | Identifying storms, hurricanes, wildfires |
| Infrared Imagery | Temperature of clouds and land surfaces | Detecting areas of high and low pressure, identifying thunderstorms and their intensity, tracking movement of weather systems |
| Water Vapor Imagery | Movement of moisture in the atmosphere | Identifying areas of high and low pressure, tracking the movement of storms, detecting formation of tropical cyclones |
How to Interpret Visible Satellite Images
Visible satellite images are a useful tool for weather analysis. They provide real-time information on cloud cover, atmospheric circulation, and weather patterns. To interpret visible satellite images, you need to understand how to identify clouds and interpret colors.
Identifying Clouds
Clouds appear in visible satellite images as white or gray areas. They can be classified into different types based on their shape and altitude. Here are some common cloud types you will encounter:
- Cumulus clouds: These are puffy and white clouds that resemble cotton balls. They are often associated with fair weather but can also produce thunderstorms.
- Stratus clouds: These are low-lying clouds that appear as a flat, featureless layer. They are often associated with fog and drizzle.
- Cirrus clouds: These are thin, wispy clouds that form at high altitudes. They are often associated with fair weather but can also indicate an approaching storm.
- Cumulonimbus clouds: These are tall, towering clouds that can produce thunderstorms, hail, and tornadoes.
Interpreting Colors
The colors in visible satellite images can provide valuable information on the atmosphere’s temperature, moisture content, and other weather conditions. Here are some common color interpretations:
| Color | Interpretation |
|---|---|
| White | High clouds, such as cirrus or cumulonimbus |
| Gray | Low clouds, such as stratus or fog |
| Yellow/Orange | Desert areas or wildfire smoke |
| Green | Vegetation or thunderstorm clouds |
| Blue | Water, such as oceans or lakes |
By understanding how to identify clouds and interpret colors, you can use visible satellite images to make informed decisions about weather conditions and plan your activities accordingly.
How to Interpret Infrared Satellite Images
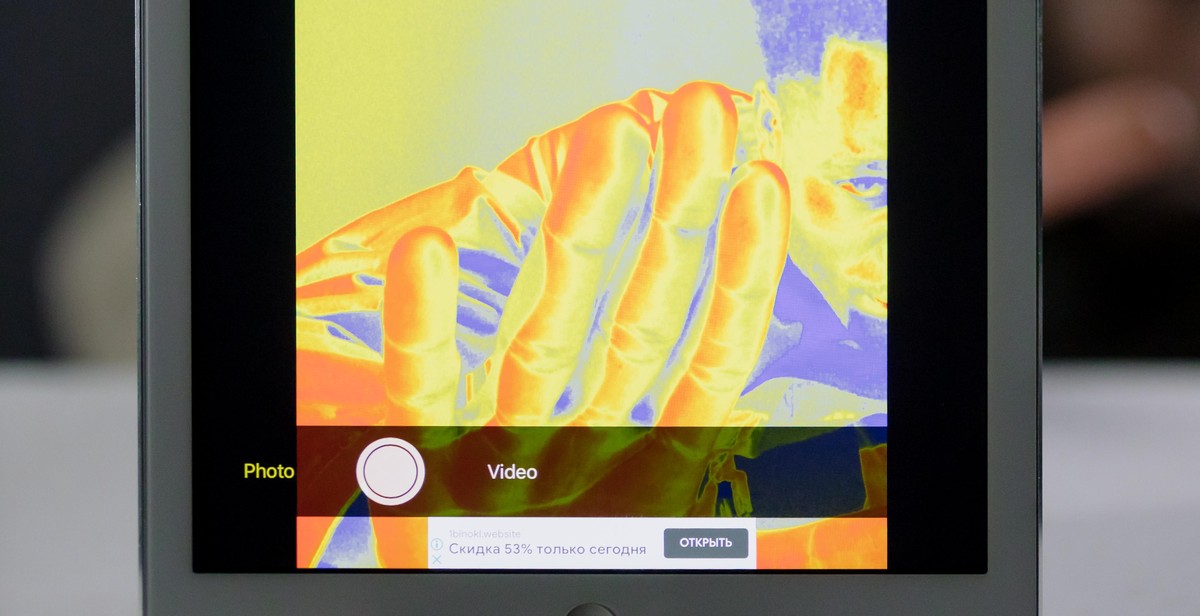
Infrared satellite images are a crucial tool for weather analysis as they help to identify temperature variations in different regions. Infrared satellite images are generated using sensors that detect the thermal radiation emitted by the earth’s surface and atmosphere. The images are then color-coded to represent temperature variations in different regions. Here is a guide on how to interpret infrared satellite images:
Identifying Temperature
Infrared satellite images are color-coded to represent different temperature ranges. The warmer the temperature, the brighter the color. The coldest temperatures are represented by dark colors. The most common color scales used in infrared satellite images are:
- Black and white
- Blue to red
- Green to purple
It is essential to understand the color scale used in an infrared satellite image to interpret temperature variations correctly.
Interpreting Colors
The colors in infrared satellite images indicate temperature variations in different regions. For instance, in a blue to red color scale, blue represents colder temperatures, while red represents warmer temperatures. Therefore, regions with blue colors are colder than those with red colors.
Additionally, the brightness of the colors indicates the intensity of the temperature. Brighter colors represent more intense temperatures, while darker colors represent less intense temperatures.
It is crucial to note that infrared satellite images can also be affected by cloud cover, which can affect the accuracy of temperature measurements. Therefore, it is essential to use other weather analysis tools to verify temperature readings in areas with significant cloud cover.
By understanding how to interpret infrared satellite images, you can accurately analyze temperature variations in different regions and make informed weather predictions.

How to Interpret Water Vapor Satellite Images
Water vapor satellite images are an essential tool for weather analysis, helping meteorologists identify moisture and interpret weather patterns. Here are some tips on how to interpret water vapor satellite images:
Identifying Moisture
Water vapor satellite images show the amount of moisture in the atmosphere. Regions with high moisture content appear white or gray, while areas with low moisture content appear black. This can help meteorologists identify areas of potential precipitation or thunderstorms.
The water vapor imagery also helps identify areas of dry air, which appear as dark areas on the image. These areas are usually associated with high-pressure systems and can indicate fair weather.
Interpreting Colors
The colors on water vapor satellite images can provide valuable information about the atmosphere’s temperature and moisture content. For example, blue and green colors indicate lower temperatures and moisture content, while yellow, orange, and red colors indicate higher temperatures and moisture content.
The brightness of the colors can also indicate the strength of the moisture content. Brighter colors indicate stronger moisture content, while duller colors indicate weaker moisture content.
It’s important to note that water vapor satellite images are just one tool in weather analysis and should be used in conjunction with other data sources. However, interpreting these images can provide valuable information about the atmosphere’s moisture content and help identify potential weather patterns.
Tips for Analyzing Weather Satellite Images
Interpreting weather satellite images can be challenging, but there are some tips that can help you make the most of the data available. Here are some strategies to consider:
Compare Images Over Time
One of the most effective ways to analyze weather satellite images is to compare them over time. This can help you identify patterns and trends that may be difficult to see in a single image. By looking at a sequence of images, you can track the movement of weather systems, such as storms or fronts, and see how they evolve over time.
Use Multiple Types of Images
It’s important to use multiple types of weather satellite images to get a complete picture of weather patterns. Different types of images provide different information, so using a variety of images can help you identify and analyze weather features more accurately. For example, visible satellite images can help you see clouds and other atmospheric features, while infrared images can show you the temperature of the atmosphere and help you identify areas of high and low pressure.
Consider Other Data Sources
Weather satellite images are just one tool in a meteorologist’s toolkit. To get a more complete picture of weather patterns, it’s important to consider other sources of data as well. This may include radar data, surface observations, and upper-air soundings. By combining data from multiple sources, you can develop a more accurate understanding of current and future weather conditions.
| Type of Image | Description |
|---|---|
| Visible Image | Shows clouds and other atmospheric features using visible light. |
| Infrared Image | Shows the temperature of the atmosphere and can help identify areas of high and low pressure. |
| Water Vapor Image | Shows the movement of moisture in the atmosphere and can help identify areas of potential weather disturbances. |